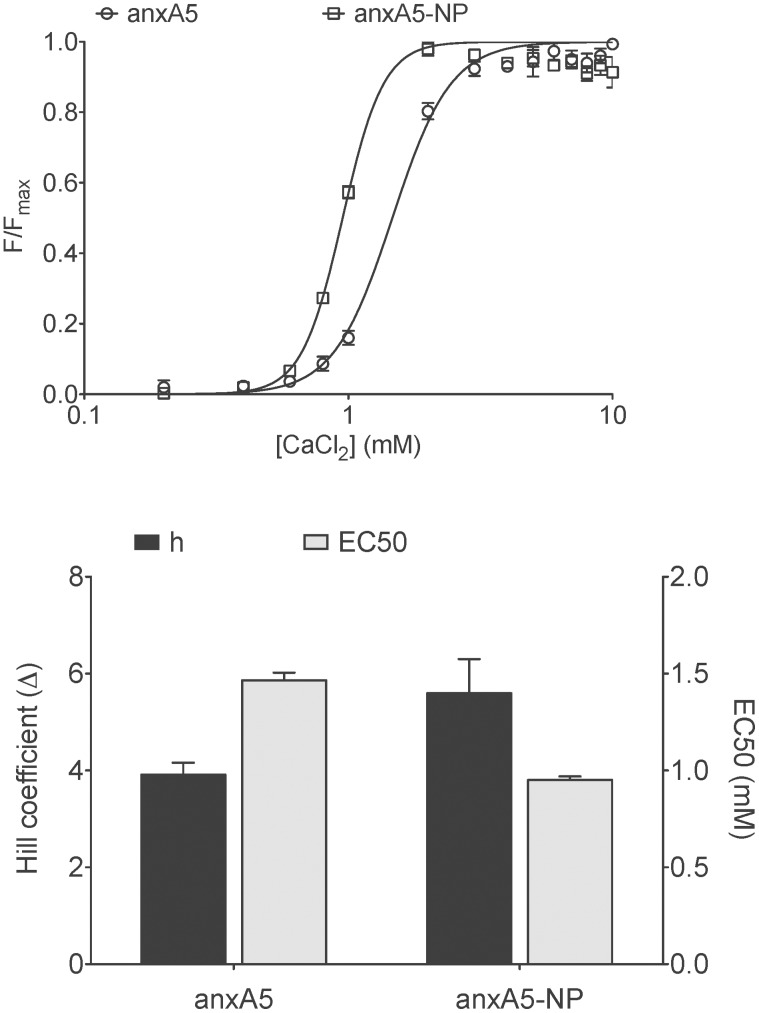
Figure 4. Red blood Cell (RBC) binding of anxA5 variants at low membrane density (1*104 molecules/cell) as determined by calcium titration.
(A) Calcium titration curves of anxA5 (open circles) and anxA5-NP (open squares). Each point is the average of three experiments with bars indicating SEM. (B) Hill coefficient (black bars) and EC50 (grey bars) of anxA5 and anxA5-NP as determined from calcium titration curves.

