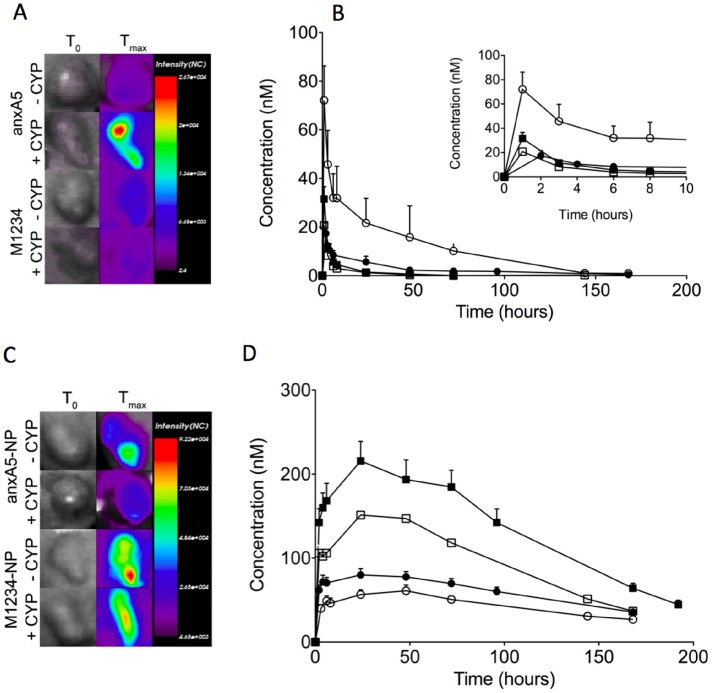
Figure 6. Non-invasive optical imaging of kinetics of tumor-uptake of fluorescently labeled annexin-variants in tumor bearing NMRI nude mice untreated (–CYP) or treated with cyclophosphamide (+CYP).
Panels A and C show representative pictures of tumors of mice injected with anxA5 and M1234 (A), and anxA5-NP and M1234-NP (C). Panel B illustrates the time courses of tumor levels of anxA5 (closed circles, –CYP; open circles, +CYP) and M1234 (closed squares, –CYP; open squares, +CYP). The inset shows the time-courses during the first 10 hours. Panel D represents the time-courses of tumor levels of anxA5-NP (closed circles, –CYP; open circles, +CYP) and M1234 (closed squares, –CYP; open squares, +CYP).

