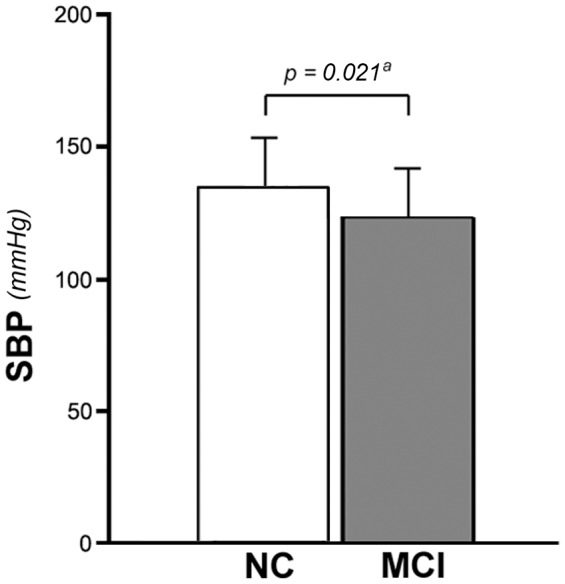
Figure 3. Systolic blood pressure after 10 minutes of active standing in the two groups of subjects.

Bars represent the mean and error bars represent one standard deviation (SD). a adjustment for potential confounders by means of multiple linear regression (see text for details). SBP: systolic blood pressure; NC: normal cognition (controls); MCI: mild cognitive impairment.
