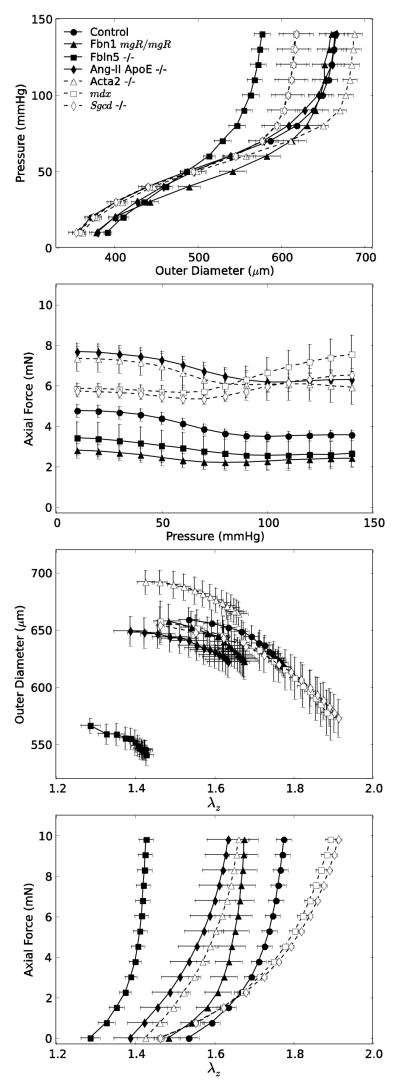
Figure 1.
Mean ± standard error of the mean data for the seven experimental groups listed in Table 1 and collected via P-d tests (left panels) performed at the individually estimated in vivo axial stretches (as determined from the force – pressure responses) and f–l tests (right panels) performed at 100 mmHg. Filled symbols and solid lines show data for controls and extracellular matrix affected mice (Fbn1mgR/mgR, Fbln5−/−, Ang-II ApoE−/−), whereas open symbols and dashed lines show data for smooth muscle cell affected mice (Acta2−/−, mdx, Sgcd−/−). Despite a general clustering of circumferential behaviors (cf. top panels), there was greater variation in axial behaviors (bottom panels), which highlights the importance of biaxial comparisons of mechanical properties across different models.

