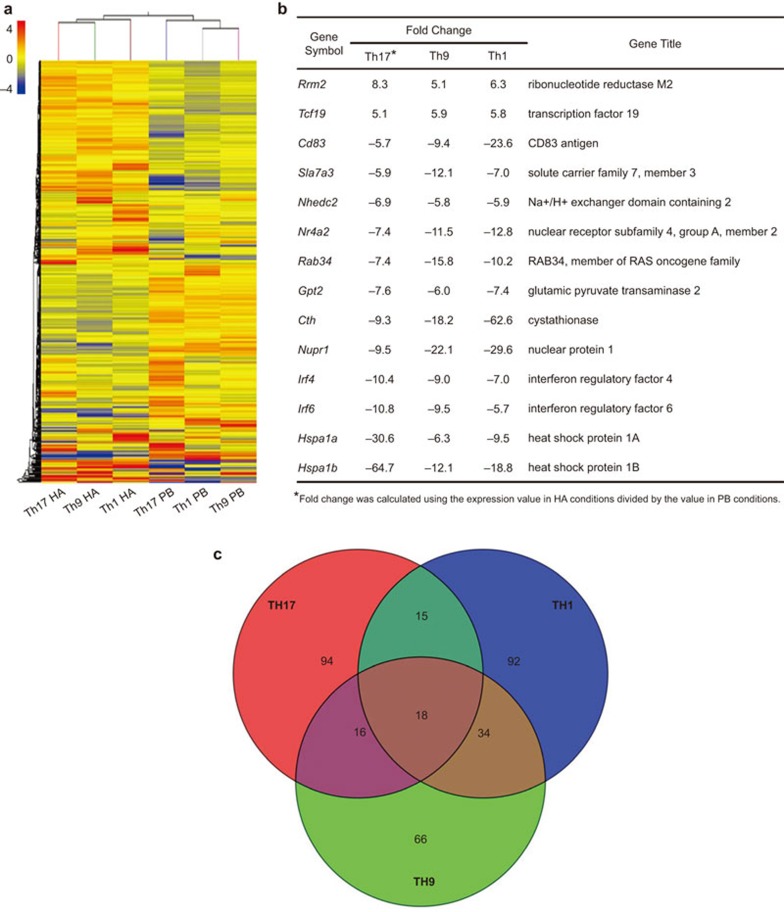
Figure 4.
Microarray analysis of genome-wide expression differences among the six different Th cell lineages. (a) A hierarchical clustering analysis of 20 175 probe sets with expression changes of at least twofold between any of the two conditions (‘HA' and ‘PbAb'). The color coding depicts the normalized expression value for each probe, with red representing higher expression and green representing lower expression as compared to the mean of the same probe across all samples. (b) A list of 14 unique genes (representing 18 probes) with at least fivefold increase or decrease in gene expression among all Th lineages stimulated by HA as compared to their expression in their counterpart lineages stimulated by PbAb. (b) A Venn diagram indicating the overlap and difference among Th17, Th1 and Th9 categories. Probe sets with at least fivefold increase or decrease in gene expression between HA- and PbAb-stimulated Th17, Th1 and Th9 cells are summarized in the Th17, Th1 and Th9 categories, respectively. Ab, antibody; Th, T-helper.

