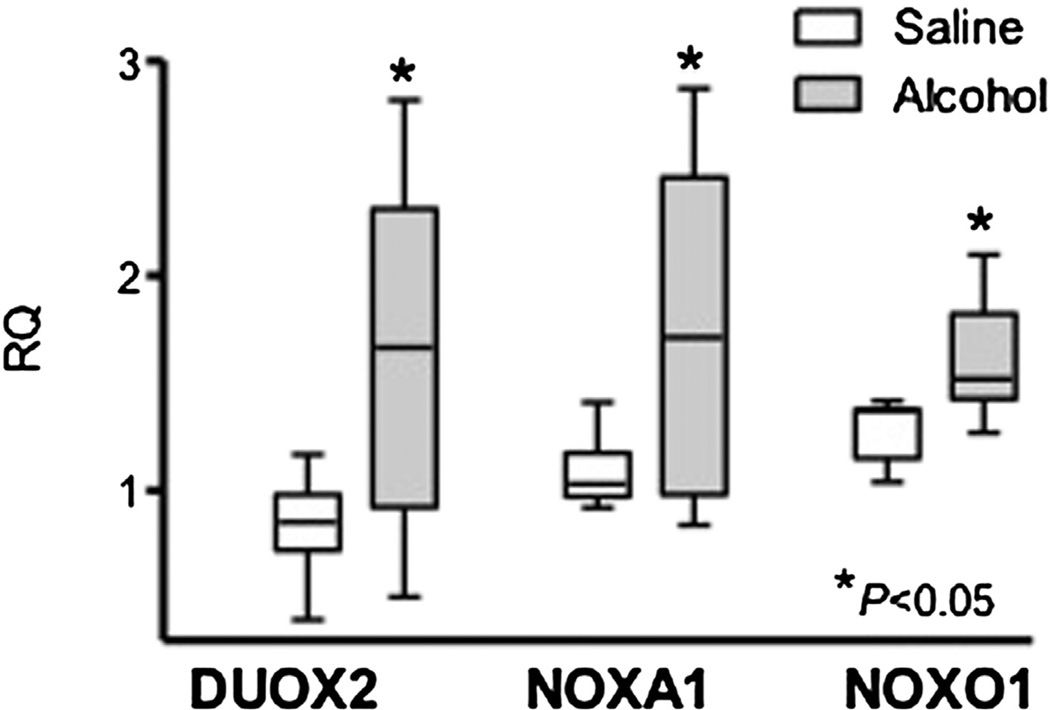
Figure 2. Box plot of enzyme mRNA expression.
Box plot of enzyme mRNA expression (RQ) in the fetal brain in alcohol- (8 litters) and saline -(7 litters) exposed groups for DUOX2 (P = .03), NOXA1 (P = .04), and NOXO1 (P = .02). The box extends from the 25th percentile to the 75th percentile with a line at the median (the 50th percentile). Whiskers show the highest and lowest values. The asterisk denotes the statistically significant differences (P < .05) between the groups.
mRNA, messenger RNA; RQ, relative quantity.
Hill. NADPH oxidase and fetal alcohol syndrome. Am J Obstet Gynecol 2014.

