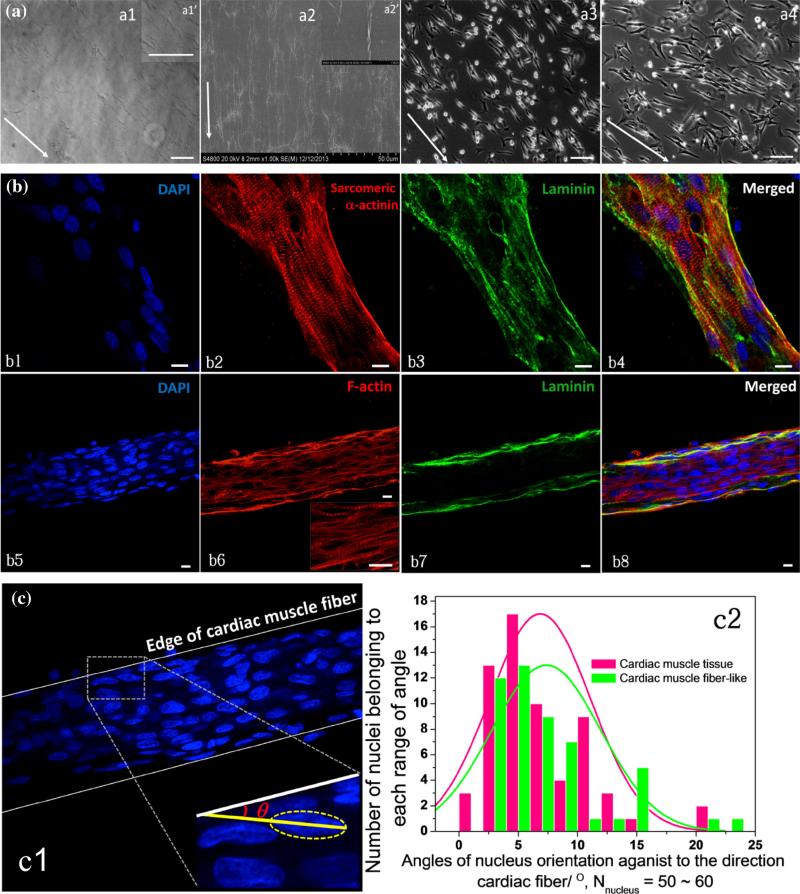
FIGURE 2.
(a) a1: Morphologies of ACG coating on a glass coverslip; a1′: Upper-right box: enlarged image of aligned collagen I fibrils. a2: Collagen fibrils formed on ACG-coated coverslip imaged by SEM; a2′: Upper-right box: enlarged image of aligned collagen I fibrils imaged by SEM. a3 and a4: NCMs cultured on ACG at 24 and 48 h, arrows indicate orientations of ACG, scale bars: 100 μm. (b) Confocal images of immunocytostaining of nucleus (DAPI in blue, b1 and b5), sarcomeric α-actinin (red, b2), F-actin (red, b6), and laminin (green, b3 and b7) of NCMs cultured on ACG at 192 h, scale bars: 10 μm. (c) Evaluation of angle θ c1) of nucleus orientation to the edge of cardiac muscle fiber-like structure comparing it to cardiac muscle tissue, 50–60 nuclei were evaluated in each group, their distributions of θ are shown in the histogram of c2, p = 0.24 > 0.05.

