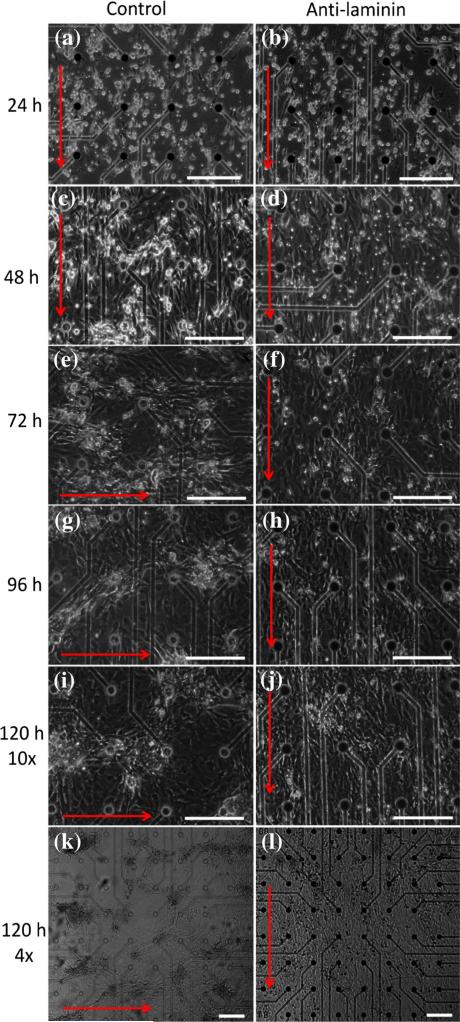
FIGURE 3.
Morphologies of NCMs growing on the ACG-coated MEA chip in control and anti-laminin groups from 24 to 120 h. (a, c, e, g, i and k) Control group cultured at 24, 48, 72, 96, 120 (10×) and 120 (4×) h, respectively. (b, d, f, h, j and l) Anti-laminin group cultured at 24, 48, 72, 96, 120 (10×) and 120 (4×) h, respectively. Red arrows indicate the directions of collagen fibrils. Scale bars: 200 μm.

