
Figure 2.
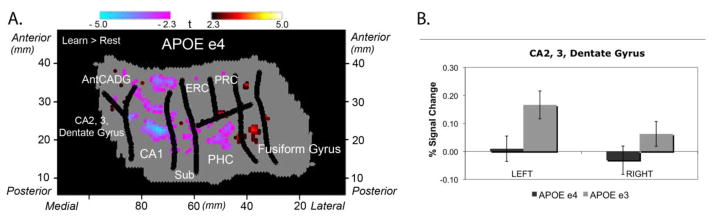
(Adapted from Suthana et al., 2010): On the left is group voxel based-mixed effects unfolded t-test maps (statistical maps of significantly activated and deactivated regions; learn > rest; −2.3 > t > 2.3, p < 0.05 corrected) in 32 subjects (n=16 ε4 carriers). While both groups showed significant increases and decreases compared to baseline during the encoding phase of the task, 4 carriers did not show the increased activation in CA23DG that non-carriers demonstrated. Direct comparison of the % signal change in both genetic risk groups is shown on the right.