
Figure 3.
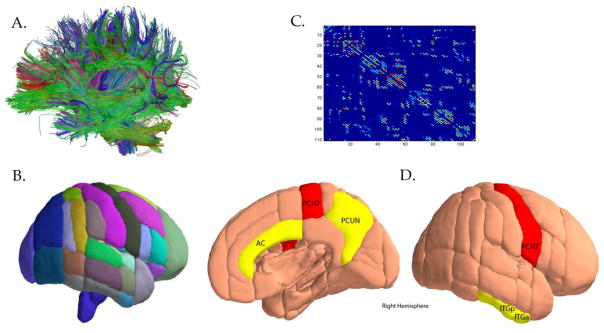
A). Fiber tractography was used to derive whole brain structural graphs; B). Graph theory was then applied to assess structural network properties for each region based on the Harvard-Oxford subcortical and probabilistic atlases; C). Connectivity matrices were created for every region’s connectedness to other brain regions; D). Adapted from Brown et al. PNAS 2011 with permission: Nodes with significant negative APOE-4 x age interaction for clustering coefficient (P < 0.05 corrected; FDR corrected), while nodes colored in red indicated the same measure at an exploratory threshold (P < 0.005, uncorrected). The abbreviations for nodes include: FORB (frontal orbital cortex), AC, anterior cingulate; ITGa, inferior temporal gyrus (anterior); PCUN, precuneus (posterior); PCNT, precentral gyrus; ITGp, SUBC, subcallosal cortex (part of the ventromedial prefrontal cortex); inferior temporal gyrus; and SMGp, supramarginal gyrus (posterior).