
Fig. 5.
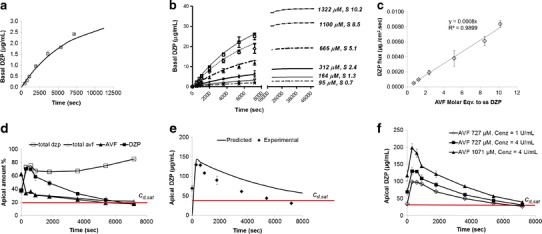
a Permeability of DZP across MDCKII-wt monolayer at near saturation solubility (85.7 μM, S = 0.7) (symbols) with flux 0.00045 ± 0.00007 μg/cm2 s. The curve represents the data fitted to Eq. (2). b Accumulation rate (on the basal side of monolayer) of DZP (symbols) produced from avizafone-protease mixtures prepared with different initial prodrug concentrations (μM). S represents the AVF molar equivalent of supersaturated (ss) DZP. Curves represent the data fitted to Eq. (3). c DZP flux at different ‘S’ values obtained from data (symbols) in b. d Concentration-time profile for the AVF- A.O. protease reaction (AVF at S = 5.6, c enz = 4 U/mL) on the apical side of MDCKII-wt membrane. ‘Total’ amount includes the amount permeating into the basal side. e % of DZP produced from prodrug/enzyme mixture (AVF at S = 5.6, c enz = 4 U/mL) in apical compartment (symbols) compared to predicted values (solid line) obtained using Eq. (4). f Concentration-time profile for DZP produced as a result of prodrug/enzyme mixture introduced onto the apical side prepared at various prodrug/enzyme ratios. In Fig. 5d–f, the horizontal (red) line represents DZP saturation level (S = 1, c d,sat). These experiments were performed in assay buffer, pH 7.4 at 32°C using 12-well Transwell plates. Mean ± SD. n = 4