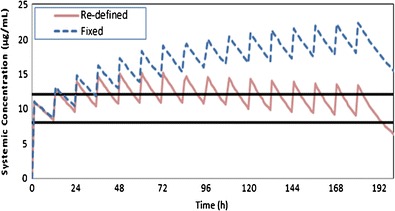
Fig. 3.

Simulated profiles for theophylline in a virtual full-term newborn population after administration of 4.8 mg/kg iv theophylline followed by 2 mg/kg iv every 12 h. The therapeutic window (8–12 ug/ml) is bound by the two black lines. The dashed line shows the higher level predicted when re-defining individuals in the paediatric-PBPK model was not consider (baseline model) and the solid line shows the achievement of therapeutic level by using the re-defining approach (time-changing physiology paediatric-PBPK model)
