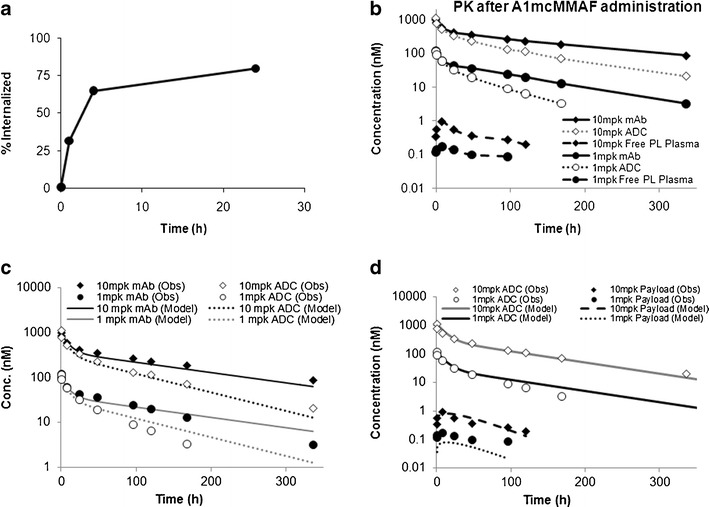
Fig. 2.

a The internalization profile of A1mcMMAF in 5T4 expressing cells. b Observed plasma PK of total mAb, ADC, and released payload, obtained after 1 and 10 mg/kg dose of A1mcMMAF, superimposed over each other. c Observed and model described plasma PK of total mAb and ADC, obtained after 1 and 10 mg/kg dose of A1mcMMAF, superimposed over each other. d Observed and model described plasma PK of ADC and released payload, obtained after 1 and 10 mg/kg dose of A1mcMMAF, superimposed over each other
