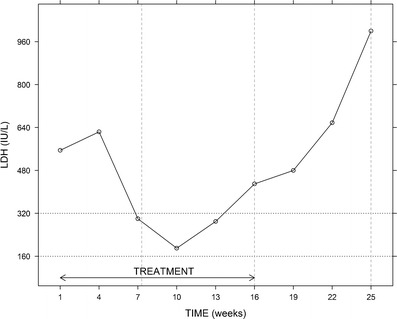
Fig. 1.

Example of an individual LDH time profile. Treatment (etoposide + platinum compound) consisted of six chemotherapy cycles administered every 3 weeks (i.e., from week 1 (diagnosis) to week 16). The three features identified in most patients are disease progression (weeks 1–4 and weeks 16–25), drug effect (weeks 4–10), and resistance effect (weeks 10–16). Vertical dashed lines represent time points at which tumor size was assessed through CT scans. Horizontal dotted lines correspond to the normal range of values of LDH
