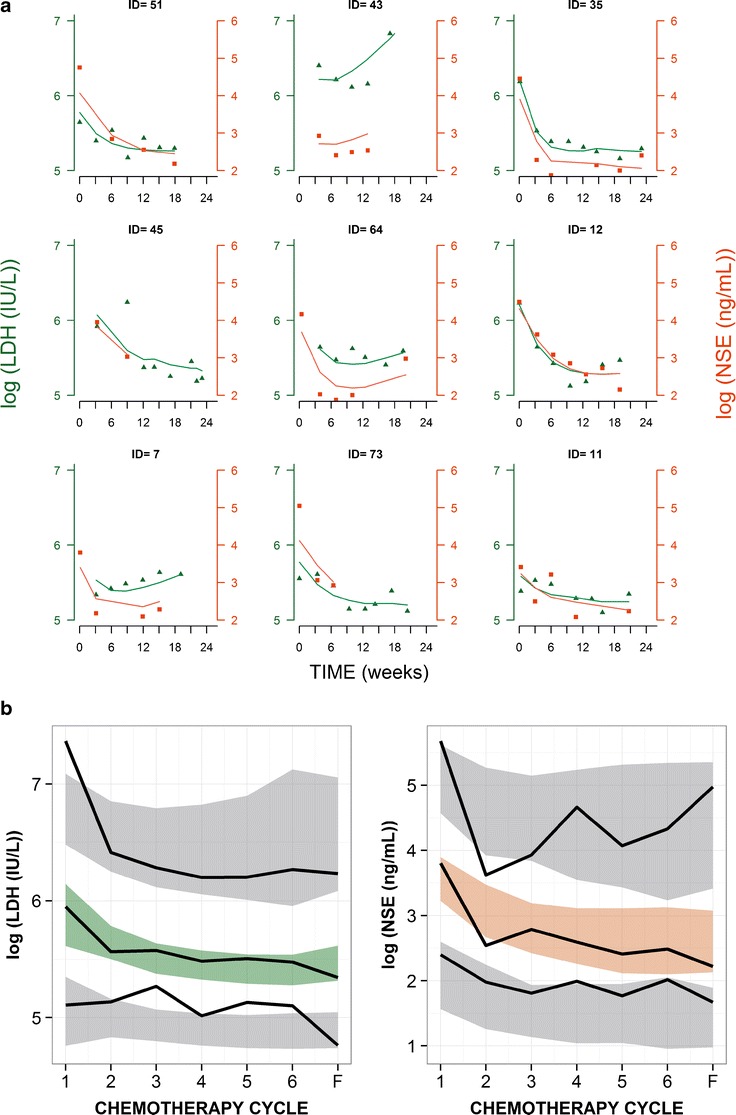
Fig. 3.

a LDH observations (green circles) with individual predictions (green lines) on the left y axis and NSE observations (orange squares) with the individual predictions (orange lines) on the right y axis for nine selected patients. Observations and predictions for both biomarkers are log-transformed. b pvc-VPC of LDH (left) and NSE (right) for the final model against chemotherapy cycles. Cycle 7 corresponds to follow-up measurement. Solid black lines represent the 5th, 50th, and 95th percentiles of the observed data. Shaded areas are the 95% confidence intervals based on simulated data (n = 1,000) for the corresponding percentiles
