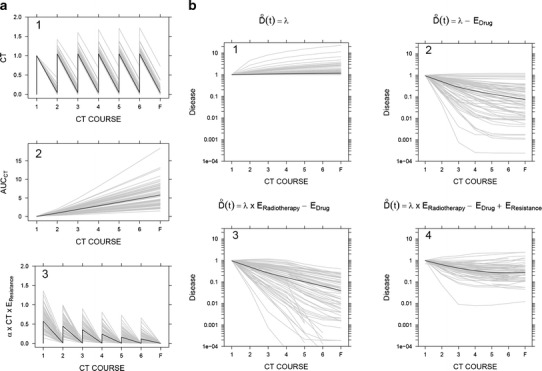
Fig. 4.

Typical simulated profiles (thick black solid lines) and individual simulated profiles (thin gray lines) from a population of 100 virtual individuals, using the model structure depicted in Fig. 2 and the estimates of model parameters shown in Table I. a Effect of chemotherapy exposure (1), the level of resistance corresponding to AUCCT (2), and drug effects in the presence of resistance (3). b Predicted disease dynamics in different scenarios: (1) disease level in the absence of any treatment, (2) disease level in presence of chemotherapy, (3) disease level under radiotherapy and chemotherapy, and (4) disease progression as it is described in our model (in the presence of radiotherapy, chemotherapy, and resistance)
