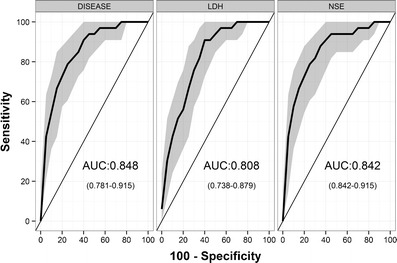
Fig. 5.

ROC curves (i.e., true positive rate (sensitivity) vs. false positive rate (100-specificity)) for discriminating observed disease progression with simulated biomarker changes. Solid lines correspond to ROC curves, and the shaded area represents the confidence intervals obtained with bootstrapping
