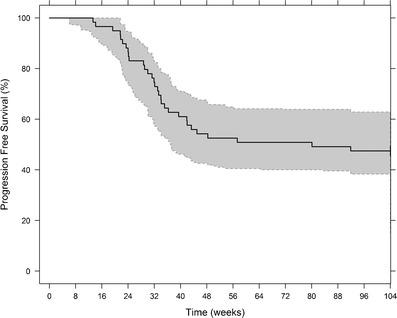
Fig. 6.

Kaplan-Meier plot of progression-free survival (black line) and 95% prediction intervals (gray shaded area) based on 1,000 simulations. The hazard rate is described by a log-logistic distribution. The baseline hazard is increased by predicted changes in the latent disease variable between CT scan times (approximately 8 weeks)
