
Fig. 1.
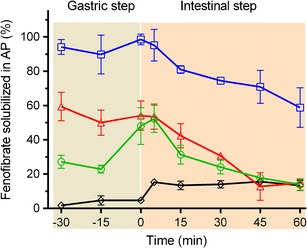
Relative distribution of fenofibrate in the aqueous phase during 30 min of gastric (pH 2, gray shaded) and 60 min intestinal (pH 6.5, orange shaded) in vitro lipolysis of SNEDDS (75% drug load, squares), 150% drug-loaded super-SNEDDS (triangles), “100 + 50%” drug-loaded SNEDDS suspension (circles), and Lipanthyl (diamonds), mean ± SD, n = 3. The drug load in each formulation was 200 mg of fenofibrate