
Fig. 4.
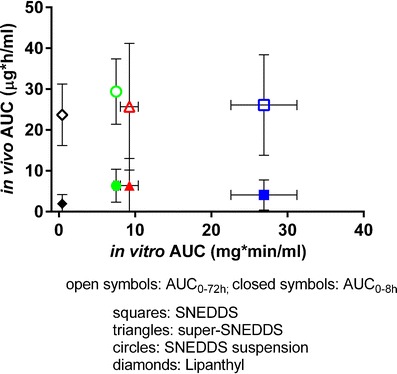
Relationship between the areas under the plasma concentration-time curves (AUCin vivo) and the area under the solubilization-time curves (AUCin vitro) during intestinal lipolysis. Open symbols represent the AUC0–8 h, closed symbols AUC0–72 h. Formulations include SNEDDS (squares), super-SNEDDS (triangles), SNEDDS suspension (circles), and Lipanthy (diamonds)