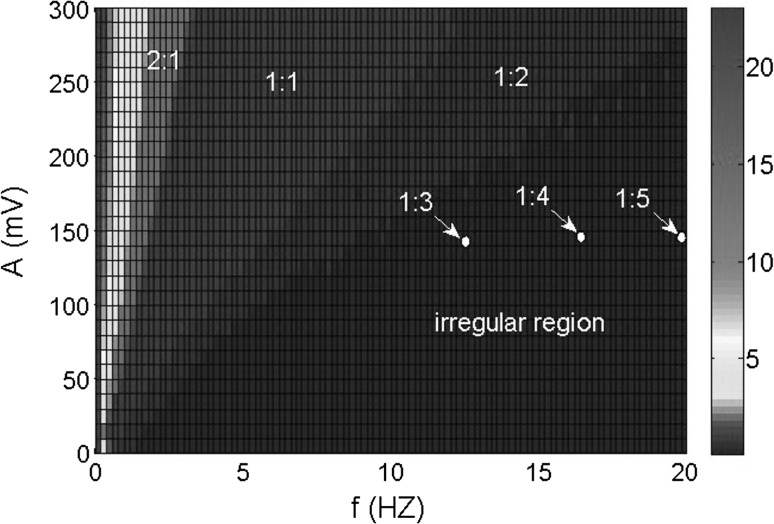
Fig. 16.
Firing patterns based on the average firing rate in the two-parameter space of applied field frequency and amplitude. The color depth denotes the firing rate. The marked regions are the specific phase locking patterns. The irregular region reveals most states in this region are irregular spiking patterns except for very few phase locking patterns such as 1:3, 1:4, 1:5 mixed up with them. (Color figure online)

