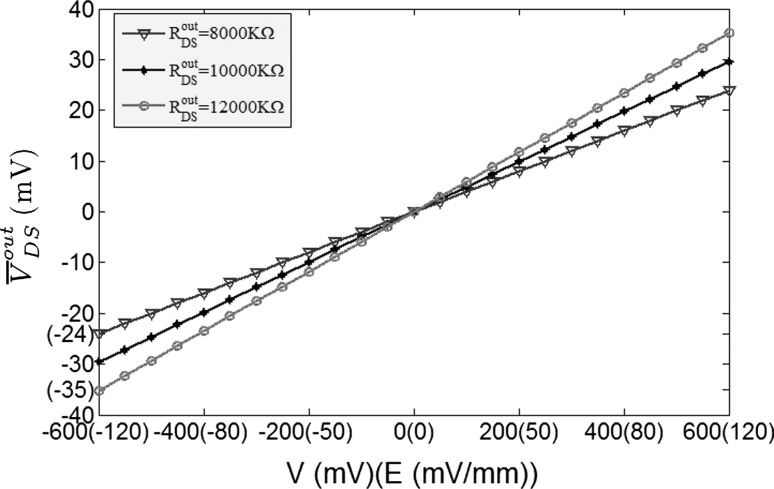
Fig. 2.
The steady DC component of the induced voltage ( ) response to the applied extracellular electric field is plotted in different extracellular resistances R
outDS = 8,000, 10,000, 12,000 (KΩ). The voltage difference V varying from −600 to 600 mV correspond to the range of electric field magnitudes

