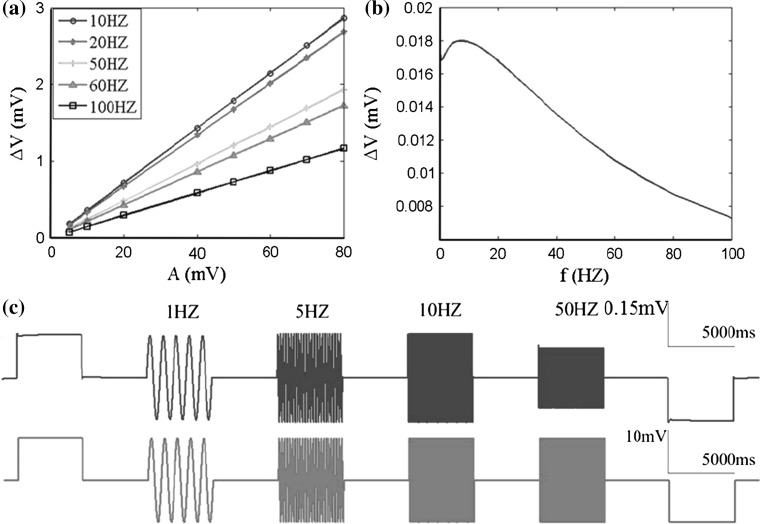
Fig. 5.
Effect of applied electric fields on neuronal membrane potential in subthreshold oscillation based on the WFEM shown in Eqs. (8–10) in “Appendix”. a Membrane potential as a function of applied field strength in different frequencies. b The normalized membrane potential changes versus applied field frequency i.e. the change of membrane potential per unit of applied electric field V. c Somatic membrane potential responses to the applied electric fields (10 mV) including positive (excitatory, left), negative (inhibitory, right) DC fields which polarity has been defined in Fig. 1 and 1, 5, 10, 50 Hz of AC fields, the red line at the bottom denotes the applied fields VE and the blue line at the top denotes the membrane potential responses. The results are obtained with C m = 5 μF/cm2, g c = 2.1 mS/cm2, r = 6, I d = −1 μA/cm2. (Color figure online)

