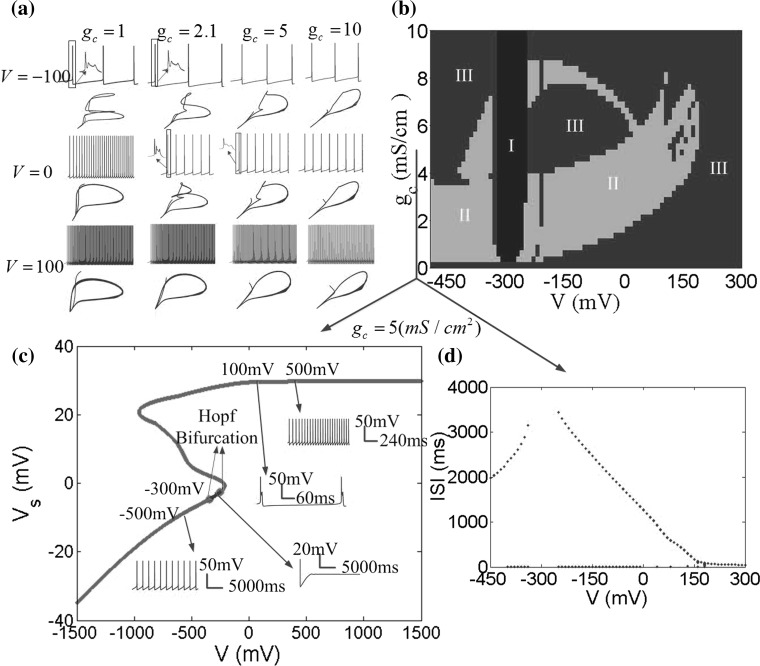
Fig. 8.
a Variety of firing patterns and the phase plane between the somatic potential V s and dendritic potential V d for different coupling conductance g c in three DC electric field V = −100, V = 0 and V = 100. b Different firing patterns in the parameter space of applied field V and the coupling conductance g c. The blue region (I) denotes no firing, the green region (II) denotes bursting, and the red region (III) denotes periodic spiking. c V s − V bifurcation diagram for g c = 5 (mS/cm2), where applied field V is considered as the bifurcation parameter. The red points refer to unstable equilibrium points and the blue points are for asymptotically stable equilibrium ones. Two green points are Hopf Bifurcation points. The bifurcation diagram is plotted with V K = −15 mV in the XPPAUT (Ermentrout 2002). d ISI (interspike interval) bifurcation diagram for g c = 5 (mS/cm2). (Color figure online)

