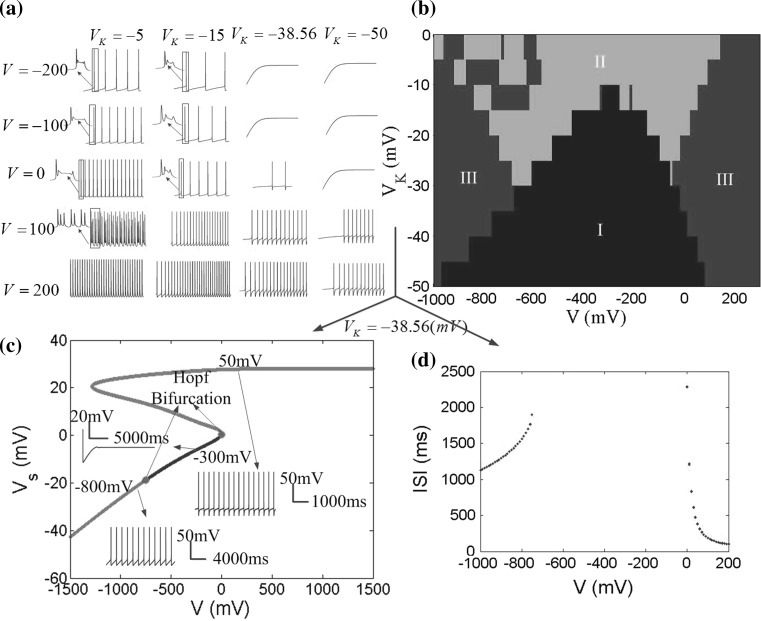
Fig. 9.
Different firing patterns in the parameters space of V K and V with g c = 2.1 (mS/cm2), and V s − V bifurcation diagram. a Time sequences of neuronal firing in different values of V K and V. b Different firing patterns in the parameters space of V K and V. The blue region (I) represents no firing at figure bottom center, the green region (II) represents bursting at figure top center and the red region (III) represents periodic spiking on the left and right of the figure. c V s − V bifurcation diagram for V K = −38.56. The red points indicate unstable equilibrium points and the blue points are for asymptotically stable equilibrium ones. Two Hopf Bifurcation points are shown in green. d ISI bifurcation diagram for V K = −38.56. (Color figure online)

