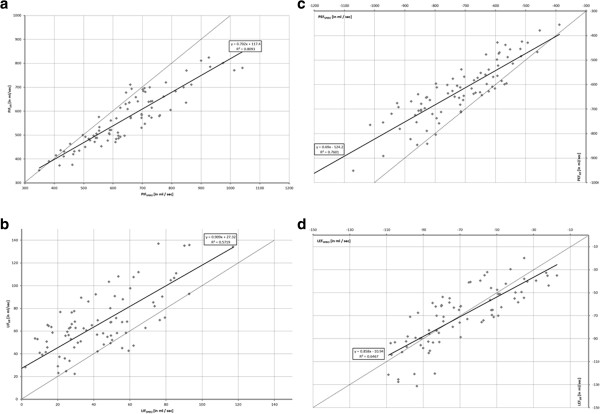
Figure 3.
Linear regression analysis and correlation of gas flow measured by EIT and spirometry. Dotted line: y = x + 0, black line: linear regression. a (left, top). Peak inspiratory flow (PIF). b (left, bottom). Late inspiratory flow (LIF). c (right, top). Peak expiratory flow (PEF). d (right, bottom). Late expiratory flow (LEF).

