
Fig. 6.
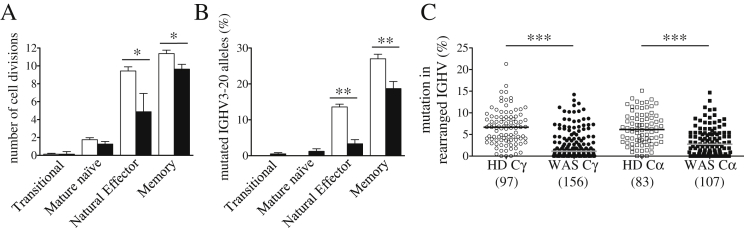
Defective in vivo B-cell maturation processes in WAS. A. Number of cell divisions was determined by KREC assay performed on DNA samples isolated from sorted peripheral B-cell subsets of 5 WAS patients (black bars) and 10 HDs (white bars). B. Frequency of somatic hypermutation, expressed as percentage of mutated hotspot in any rearranged IGκV3-20 gene segment, was determined by IgκREHMA on the same DNA samples. Bars represent mean values ± SEM. Significant values are indicated. ***P ≤ 0.0005; **P < 0.005; *P < 0.05. C. Frequencies of mutated nucleotides in rearranged IGHV genes subdivided for γ- or α-chain constant regions (Cγ or Cα) are shown. All individual data points are shown as white (HD) or black (WAS) dots and total number of analyzed sequences is reported in brackets. Differences between each WAS group compared with age-matched HDs (***P < 0.0001).