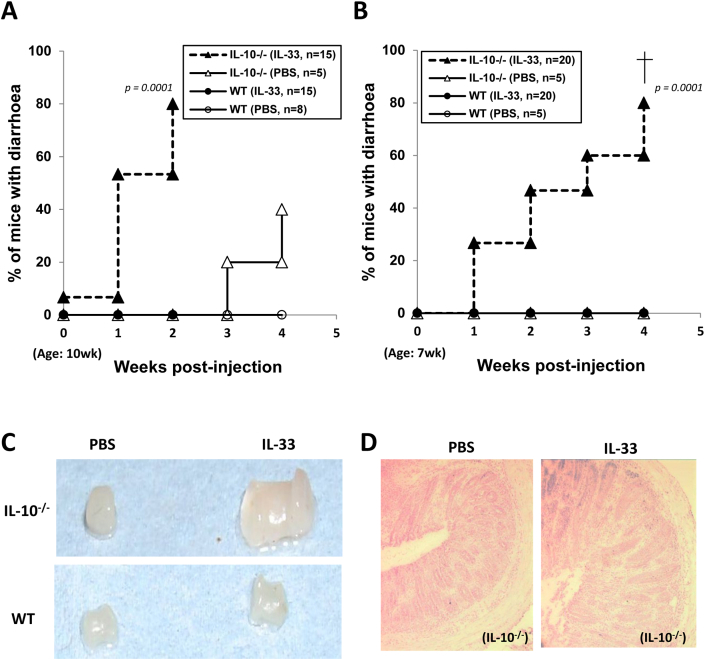
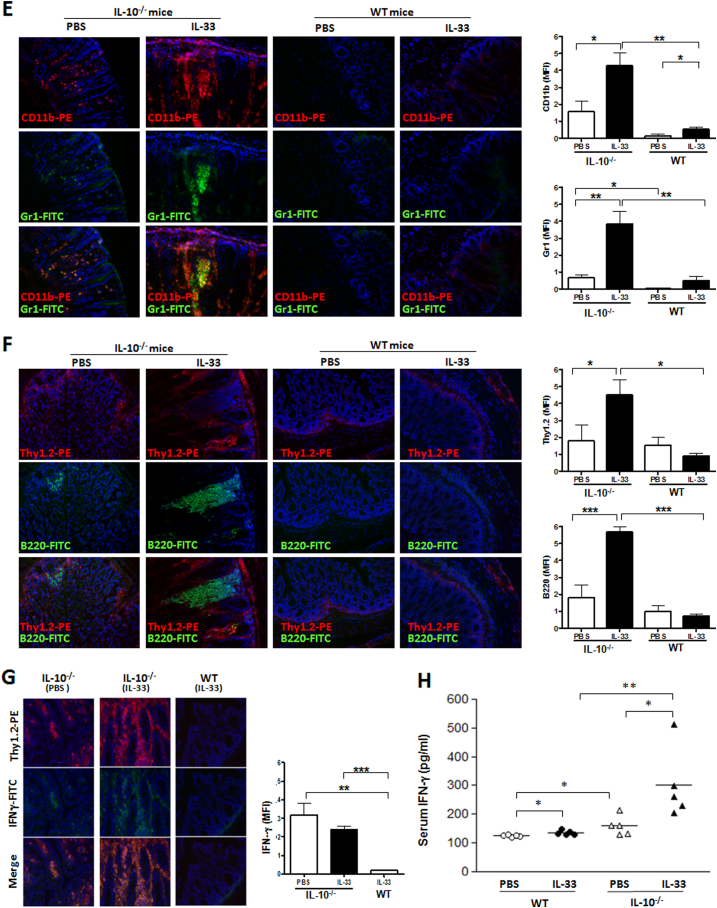
Fig. 1.
Intra-peritoneal injection of IL-33 exacerbated enterocolitis in IL-10−/− mice, but similarly treated WT control mice were protected from the IL-33-mediated mucosal inflammation. Groups of IL-10−/− and WT mice were injected i.p. with rhIL-33 (1 μg/mouse) twice a week, for 2 weeks starting at the age of 10 wk (A); or for 4 (B) or 6 (C–H) weeks starting from the age of 7 wk. Clinical disease activities (diarrhoea, rectal prolapse) were monitored throughout and, at the end of experiments, pathological changes in the colon and other organs or tissues assessed. A–B. Frequency of mice with signs of diarrhoea after IL-33 injection; C–F. Selected representative pictures showing colon enlargement (C), colonic histo-pathological changes (disruption of mucosal architecture, ulceration, epithelial hyperplasia) (D), and heavy leukocyte infiltration including monocytes (CD11b+) and neutrophils (Gr1hi) (E), T (Thy1.2+) and B (B220+) cells (F) as well as IFN-γ positive infiltrating T cells (G), in the colons of IL-33-injected IL-10−/−, but not WT control, mice. Data shown in A and B are pooled from 3 repeated experiments and the group sizes are indicated in the graphs (A, B). For further quantitative analysis of the immunostaining results (E–G, histograms), an ImageJ (NIH) picture analysis software was used to calculate mean pixel fluorescence intensity (see Methods). In order to control for background fluorescence, MFI was normalized for maximum pixel intensity. Quantitative and statistical analysis of the colonic leukocyte infiltrations was also carried out and shown (histograms) as part of E, F and G respectively (n = 5). H. Serum IFN-γ levels of the mice. Statistical analysis: p values (A–B. Log rank test; E–H. Student's t test).


