Fig. 6.
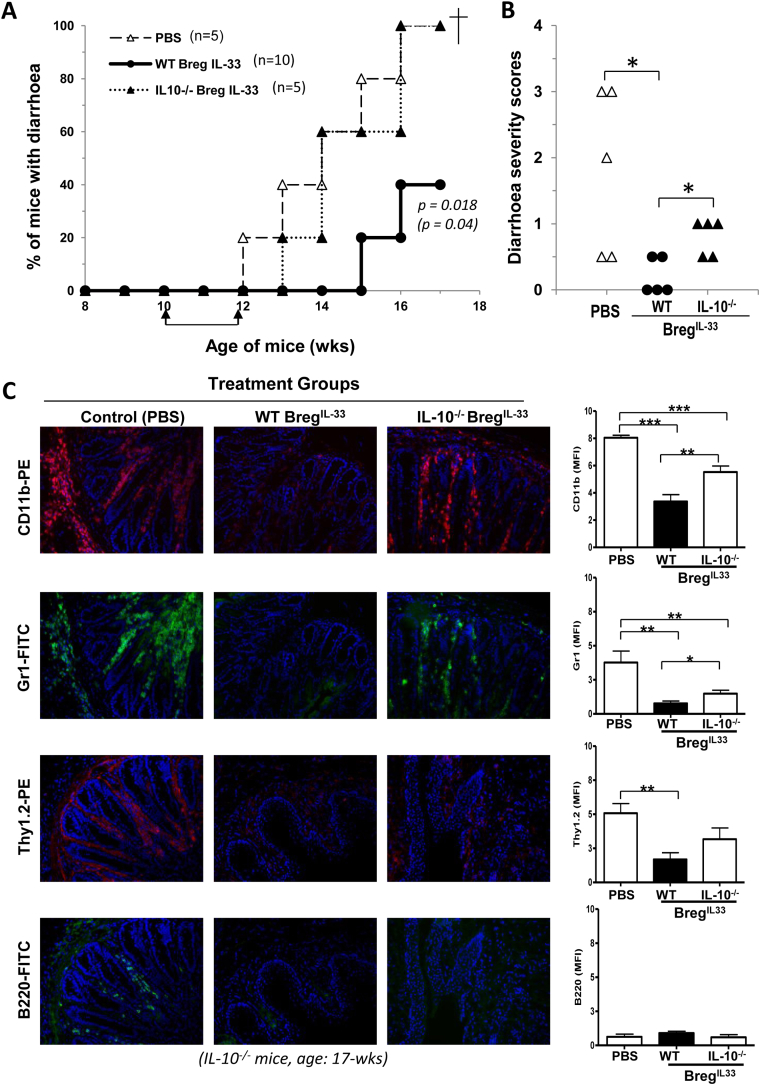
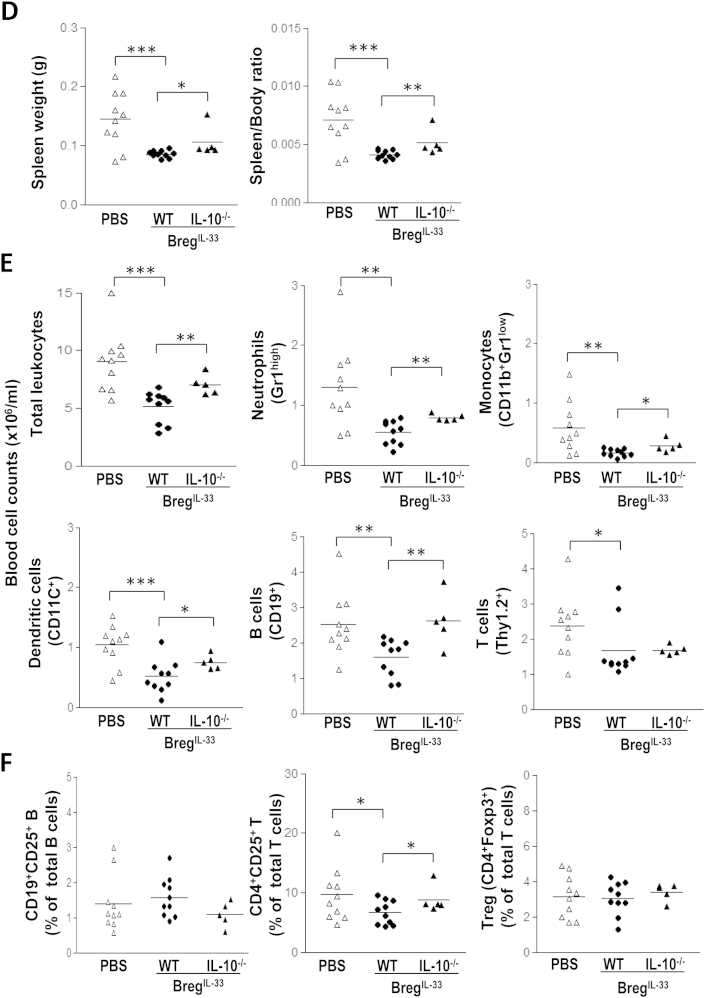
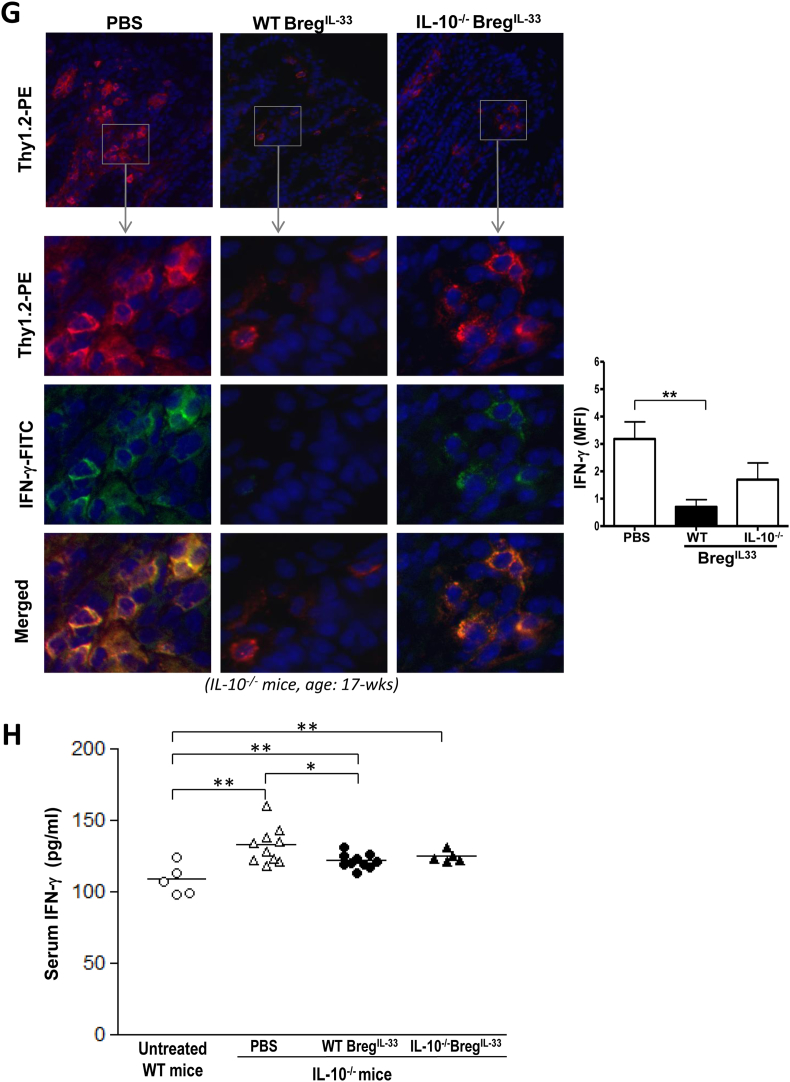
An essential role of IL-10 in the immunological mechanisms underlying BregIL-33–mediated protection against spontaneous IBD in the mouse model. As described in Fig. 5 legend, groups of IL-10−/− mice (5 and 10 mice per group as indicated in the graph) but at 10-wk of age were injected i.v. twice (at 10-wk and 12-wk) with CD19+CD23− cells (106 cells per mouse) purified from blood samples of the IL-33-treated WT (WT BregIL-33), or IL-10−/− (IL-10−/−BregIL-33), mice. Control group was IL-10−/− mice injected with PBS only (PBS). The mice were monitored twice weekly for signs of diarrhoea/disease development: A. Percentage of mice with diarrhoea. B. Diarrhoea severity scores. At the end of the experiment (7 weeks after the 1st injection, 17-wk of age), the mice were sacrificed and different organs or tissues (colon, spleen, lymph nodes) and blood samples collected and processed for assessments: C–H. Immunosuppressive effects of WT BregIL-33 and IL-10−/−BregIL-33 treatment on colonic leukocyte infiltration (C), splenomegaly (D), frequencies of different leukocytes in peripheral blood circulation (E, F) and colonic infiltrating IFN-γ expressing T cells (G), and on serum IFN-γ levels (H). For further quantitative analysis of the immunostaining results (C & G, histograms), the ImageJ (NIH) picture analysis software was used to calculate mean pixel fluorescence intensity (see Methods). In order to control for background fluorescence, MFI was normalised for maximum pixel intensity. The data shown in D–F and H are results pooled from 2 experiments and presented as individual mice (dot plots) within each of the experimental groups. Statistical analysis: A. p value in bold: WT BregIL-33-treated group versus PBS-treated control group; p value in bracket: WT BregIL-33-treated group versus IL-10−/−BregIL-33-treated group (Log rank test). B, D–F and H: *p < 0.05, **p < 0.01, ***p < 0.001 (Student's t test, unpaired, one-resp. two-tailed).


