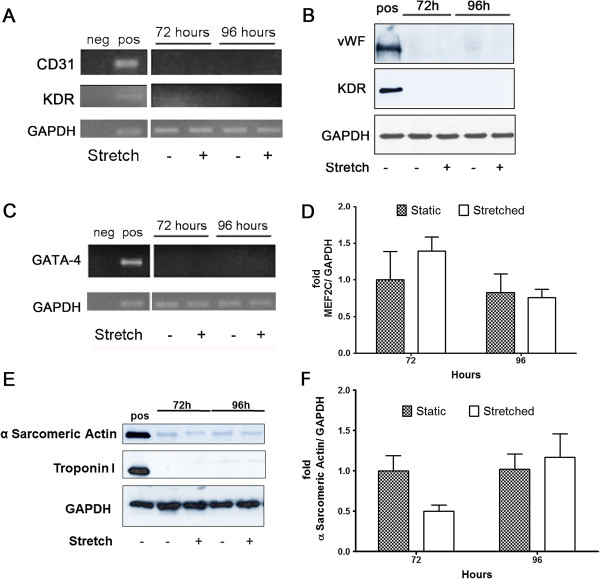
Figure 2.
Expression of Endothelial and Cardiomyocyte markers in hASCs that underwent stretching (12%, 1Hz). (A, B) Endothelial markers in hASCs that underwent stretching for 72 and 96 hours. Saphenous vein endothelial cells. (A) Representative images of CD31 and KDR gene expression (n = 5). (B) vWF and KDR protein expression (n = 3). (C-F) Analysis of cardiomyocyte markers in hASCs stretched for 72 and 96 hours. (C) Representative image of GATA4 expression analyzed by RT-PCR (n = 3). (D) MEF2C gene expression was evaluated by qRT-PCR for 72 hours (n = 5) and for 96 hours (n = 6). Data are represented as mean ± SEM and relative to 72 hours static hASCs. (E) Troponin I (n = 3) and α-Sarcomeric Actin (n = 4) representative images of western blot experiment. (F) Quantification of α-Sarcomeric Actin protein expression (n = 4). Human heart myocardium was used as a positive control. Each bar represents means ± SEM.

