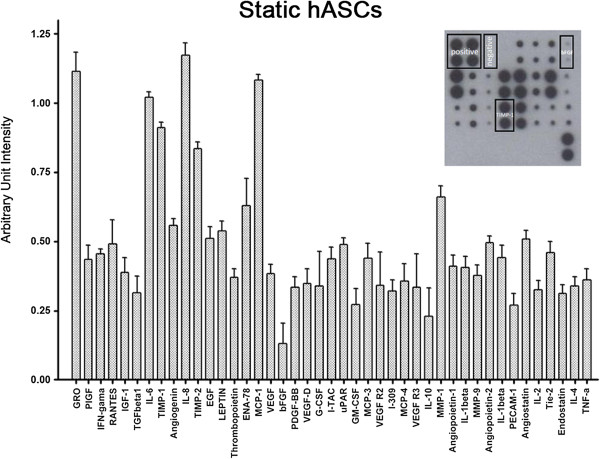
Figure 5.
Basal cytokine profile secreted by hASCs. The upper right insert is a representative image of the array membrane incubated with conditioned medium of hASCs under static condition. All the 43 angiogenic factors were plotted as arbitrary unit intensity normalized by positive controls present in each array. Each bar represents mean ± SEM of 4 independent experiments.

