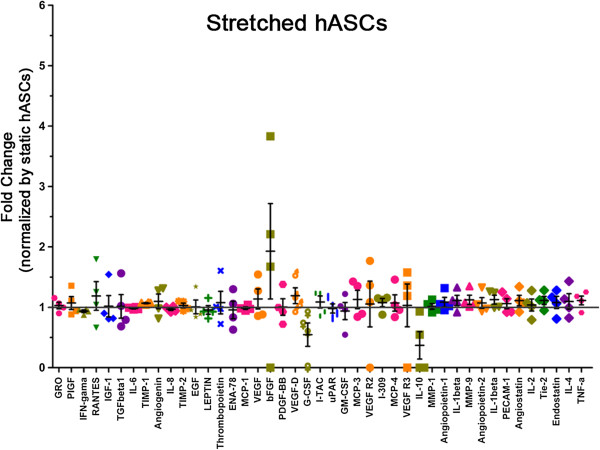
Figure 6.
Cytokine profile secreted by hASCs that underwent stretching (12%, 1Hz) for 96 hours. Data are represented as fold change secretion of stretched hASCs compared to static hASCs (n = 4, independent experiments). The gray line represents the level of secretion of static hASCs (Figure 5).

