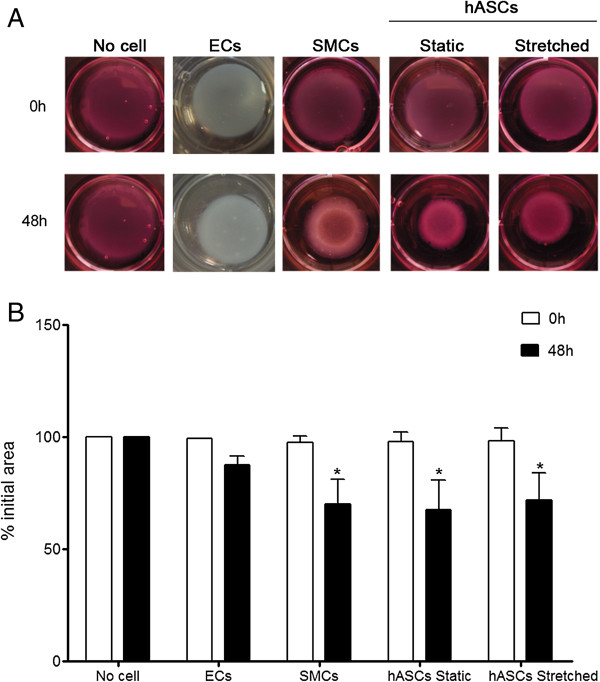
Figure 7.
Contraction assay of hASCs that underwent mechanical stimulation (12%, 1Hz). (A) Illustrative image from collagen gel discs with no cells and with endothelial cells (ECs), smooth muscle cells (SMCs), static hASCs or 96 hours stretched hASCs. ECs and SMCs from human saphenous vein were used as negative and positive controls of contraction, respectively. (B) Quantification of gel disc contraction was analyzed after 48 hours (hASCs, n = 7; SMCs n = 4; ECs, n = 2). Relative lattice area was obtained by measuring the final dimensions in comparison with its initial area. The bars represent means ± SD and * indicates p < 0.01 compared to 0 h. Sample sizes indicate data from independent experiments.

