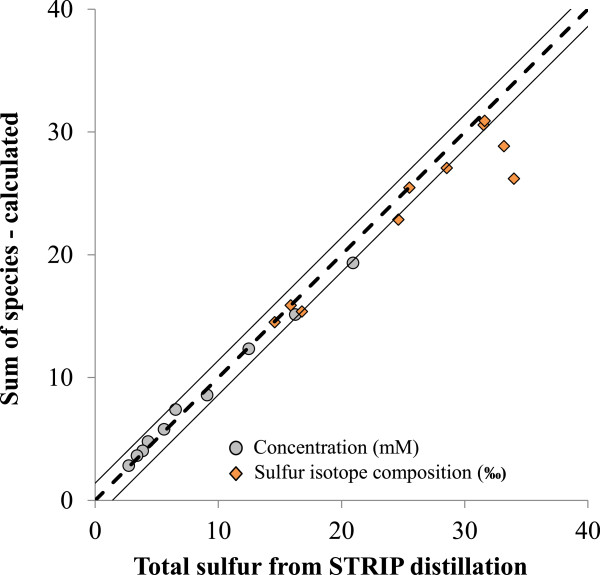
Figure 4.
Comparison of measured vs. calculated total sulfur concentrations and total sulfur isotope composition. Dashed line represents a 1:1 relationship. Deviations from this line represents a discrepancy between the sulfur mass balance and the measured values. Error margin is ± 1.4 permil (2SD for 5 ml AgNO3 trap).

