Figure 1.
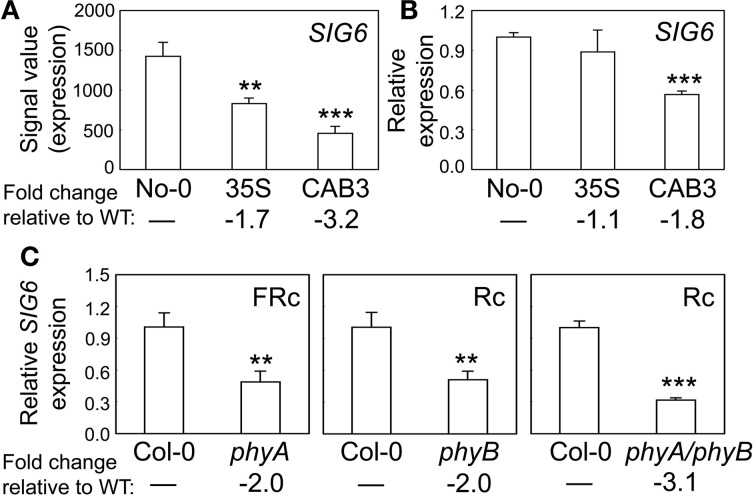
Phytochrome-dependent regulation of SIG6 expression. (A) Expression levels (signal value) of SIG6 in No-0 wild-type (WT), 35S::pBVR3 (35S), and CAB3::pBVR2 (CAB3) under continuous far-red (FRc) are shown (±SD, n = 3). Signal value indicates signal intensity on the ATH1 array as calculated by Affymetrix Microarray Suite (MAS). (B) Validation of microarray data for SIG6 using quantitative RT-PCR (qRT-PCR) analysis. Relative SIG6 expression level compared to UBC21 is shown (±SD, n = 3). (C) qRT-PCR analysis of SIG6 expression in Col-0 WT, phyA (SALK_014575), phyB (SALK_022035), or phyA/phyB double mutant seedlings under FRc or continuous red (Rc). Relative SIG6 expression level compared to UBC21 is shown (±SD, n = 3). Statistics: Unpaired, two-tailed Student's t-test comparing mutants or transgenic lines to WT, **p < 0.01, ***p < 0.005.

