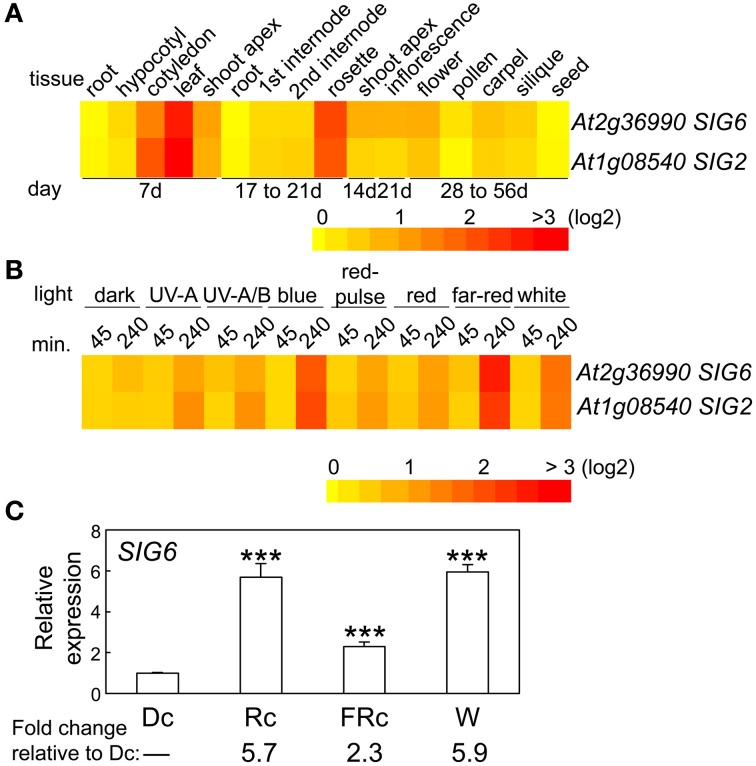
Figure 2.
Expression of SIG6 in different tissues and light conditions. (A) Heat map showing the expression of SIG6 in different tissues indicating mean-normalized values of Col-0 WT from AtGenExpress expression library (www.weigelworld.org) and BAR Heatmapper Plus (bar.utoronto.ca). (B) Heat map showing the expression of SIG6 in different light conditions for aerial parts (hypocotyl and cotyledons) of 4-days-old Col-0 WT seedlings grown on MS medium treated with different light for either 45 or 240 min. (C) qRT-PCR analysis of SIG6 expression in Col-0 WT under dark (Dc), Rc, FRc, or white (W). Relative SIG6 expression level compared to UBC21 is shown (±SD, n = 3). Statistics: Unpaired, two-tailed Student's t-test comparing different growth conditions ***p < 0.005.

