Figure 4.
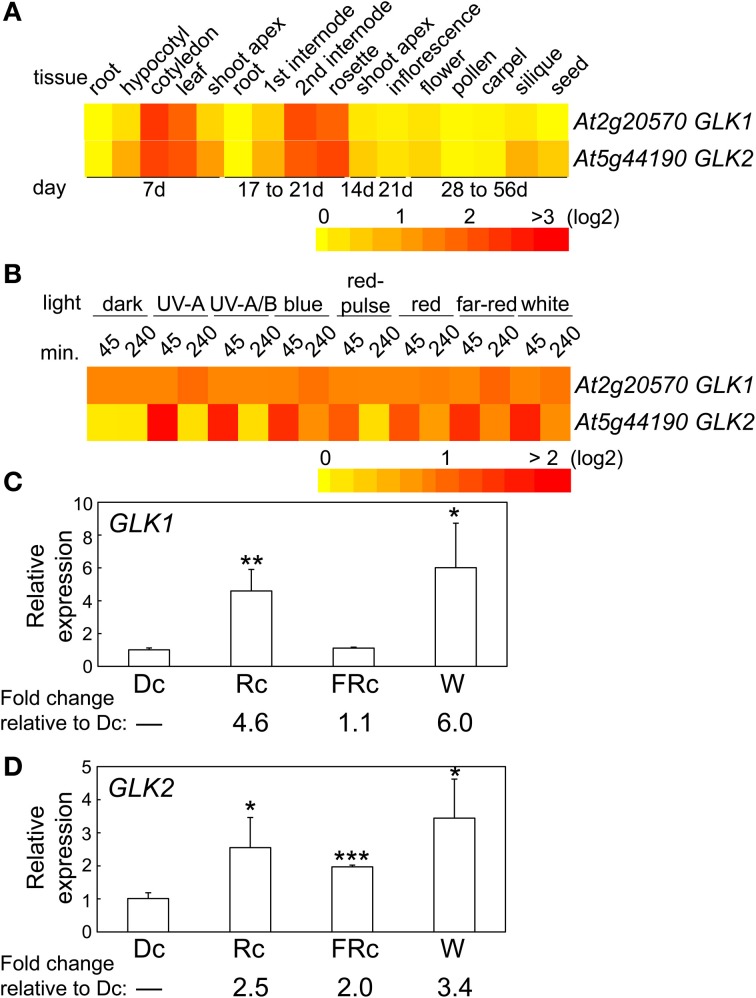
Expression of GLK1 and GLK2 in different tissues and light conditions. (A) Heat map showing the expression of GLK1 or GLK2 in different tissues indicating mean-normalized values of Col-0 WT from AtGenExpress expression library (www.weigelworld.org) and BAR Heatmapper Plus (bar.utoronto.ca). (B) Heat map showing the expression of GLK1 or GLK2 in different light conditions for aerial parts (hypocotyl and cotyledons) of 4-days-old Col-0 WT seedlings grown on MS medium treated with different light for either 45 or 240 min. qRT-PCR analysis of (C) GLK1 or (D) GLK2 expression in Col-0 WT under dark (Dc), Rc, FRc, or white (W). Relative GLK1 or GLK2 expression level compared to UBC21 is shown (±SD, n = 3). Statistics: Unpaired, two-tailed Student's t-test comparing different growth conditions *p < 0.05, **p < 0.01, ***p < 0.005.

