Figure 2.

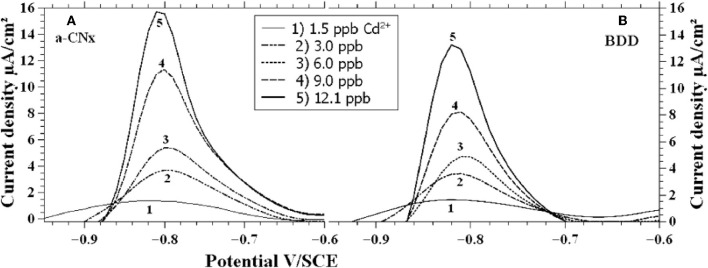
Voltammograms for a-CNx (A) and BDD (B) in solutions containing different Cd2+ concentrations. Reprinted with permission from Seck et al. (2012). Copyright 2012 Wiley-VCH.

Voltammograms for a-CNx (A) and BDD (B) in solutions containing different Cd2+ concentrations. Reprinted with permission from Seck et al. (2012). Copyright 2012 Wiley-VCH.