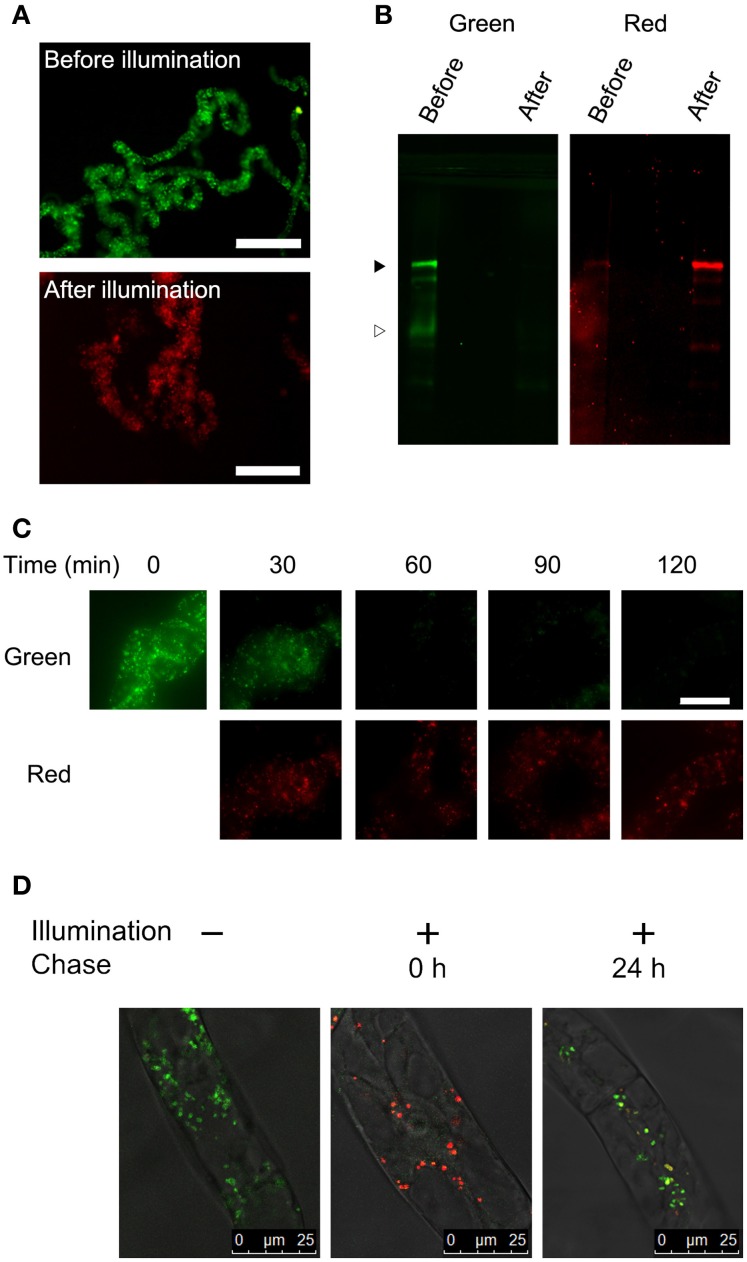
Figure 2.
Color conversion and the fate of aggregates under normal conditions. (A) Low magnification epifluorescence images of cells before and after color conversion. Epifluorescence images of cells before and 1 h after illumination of purple light were collected using Olympus WIB and RFP filter/dichroic mirror sets. Bar = 200 μm. (B) Green and red fluorescence of proteins extracted from the transformant. Proteins extracted from the cells before and after illumination with purple light for 1 h were separated by SDS–PAGE, and green and red fluorescence images were recorded. Black and white arrowheads indicate the migration positions of the intact and processed forms of Cyt b5-KikGR, respectively. Each lane contained proteins corresponding to equal volumes of cells. (C) Time-course analysis of the conversion of fluorescence emission. The cell culture was illuminated with purple light at the indicated times and red and green fluorescence images were recorded using an epifluorescence microscope. Bar = 50 μm. (D) Analysis of the proliferation and de novo generation of the aggregates. Confocal fluorescence microscopic images are shown of Cyt b5-KikGR-expressing cells before purple light illumination, just after illumination for 1 and 24 h after illumination. Green and red fluorescence images as well as the transmission images were collected as indicated in the Materials and methods. Merged images are shown.

