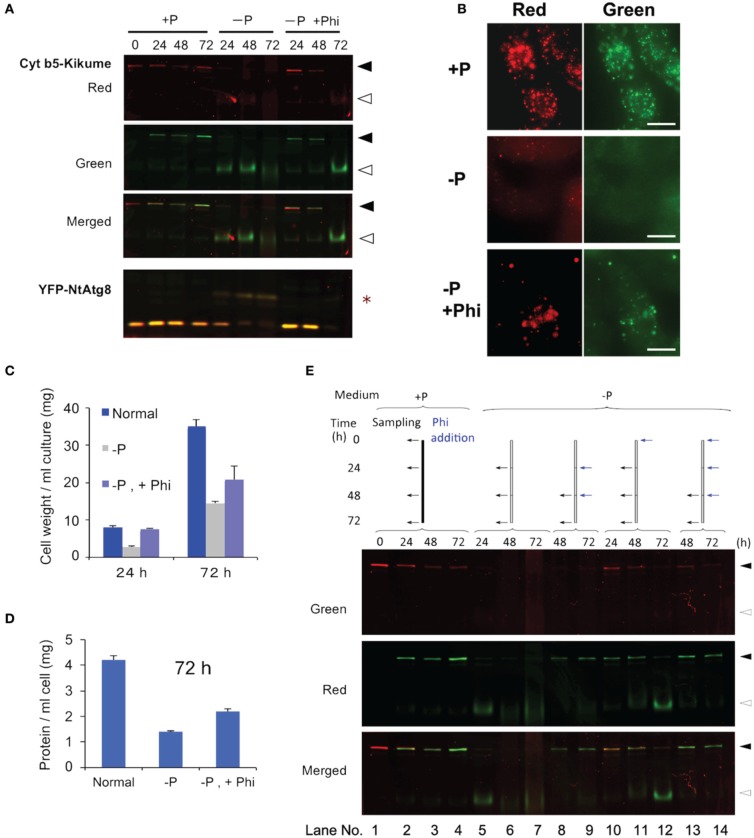
Figure 4.
Phosphite prevented Pi-starvation-induced autophagy. (A) Time-course analysis of the effects of the presence or absence of Phi under Pi-free conditions. Cells expressing both Cyt b5-KikGR and YFP-NtAtg8 (Toyooka et al., 2006) were exposed to purple light, incubated in Pi-free medium with or without 2.6 mM Phi and cultured for the indicated times. Proteins extracted from the cells were analyzed as in the legend to Figure 3A. Black and white arrowheads indicate the migration positions of the intact and processed forms of Cyt b5-KikGR, respectively. Asterisk indicate the slow-migrating form of YFP-NtAtg8. (B) Epifluorescence images of cells incubated in normal (+P) or Pi-free (−P) medium with (+Phi) or without Phi for 24 h. (C) Effect of Phi on the growth of transformed tobacco cells under Pi-starvation. Transformed tobacco cells were incubated for the indicated times as described in panel (A) above, and the weights of cells were measured after removal of the culture medium by filtration. The average of triplicate experiments is shown and the bar represents the standard deviation (SD). (D) Effect of Phi on the amount of proteins in transformed tobacco cells under Pi-starvation. Transformed tobacco cells were incubated for 72 h as described in panel (A) above, and the amount of protein was measured after extraction. The mean of triplicate experiments is shown and the bar represents the SD. (E) Continued addition of Phi prevented the induction of autophagy. Color-converted cells expressing Cyt b5-KikGR were incubated in medium with or without Pi, and Phi was added to the culture to a final concentration of 2.6 mM. When multiple additions of Phi were carried out, the concentration of Phi at each time corresponded to an additional 2.6 mM in the medium. Culture conditions and the times of addition of extra lots of Phi were carried out as indicated at the top of the figure. Proteins extracted from the cells were analyzed as in the legend to Figure 3A. Black and white arrowheads indicate the migration positions of the intact and processed forms of Cyt b5-KikGR, respectively.

