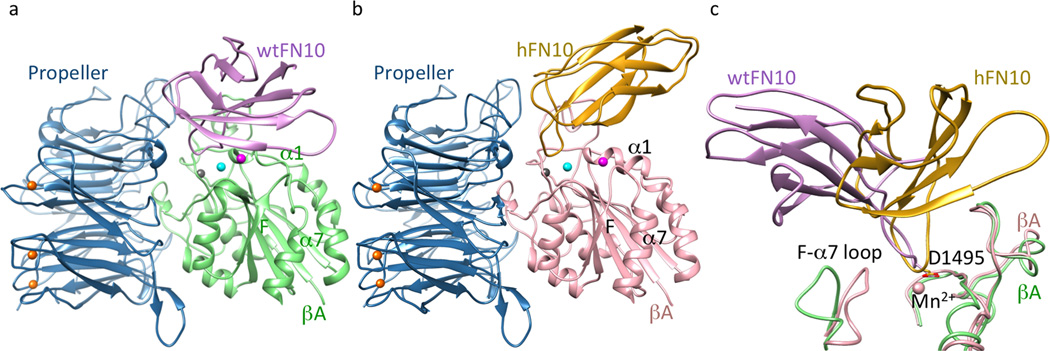
Figure 2. Structures of αVβ3 bound to FN10.

Ribbon diagrams of αVβ3 head bound to wtFN10 (a) or hFN10 (b). Orientation of the integrin head in (a) and (b) is identical. Mn2+ ions at LIMBS (gray), MIDAS (cyan) and ADMIDAS (magenta) are shown as spheres (also in Figs. 3a–b, 4c). (c) Orientation of bound FN10 relative to the superimposed βA domains (chain colors as in a, b). Mn2+ at MIDAS the ligand Asp (D1495) and the F-α7 loop are shown.
