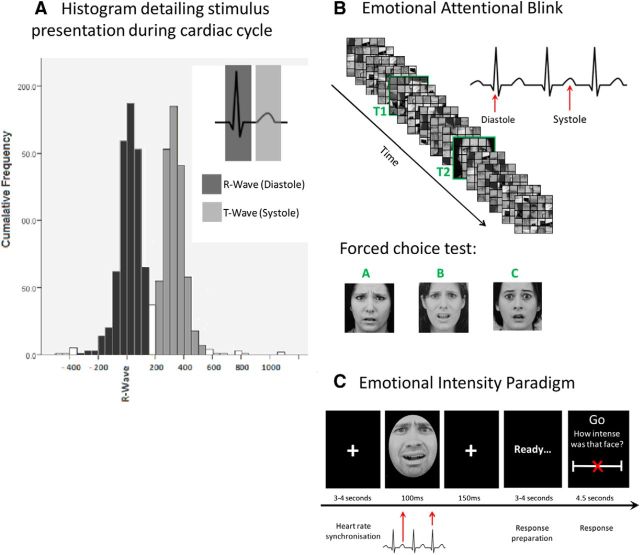
Figure 1.
A, Histogram detailing fear and neutral face presentation in relation to cardiac cycle within the MRI scanner. For Experiments 1 and 2, stimulus presentation was time locked to coincide with distinct points of the cardiac cycle. B, For Experiment 1, participants were required to detect two targets (T1 and T2, outlined in green for illustrative purposes in this diagram only) embedded within an RSVP. T2 (face) detection served as the variable of interest, as determined by a subsequent forced-choice recognition test. C, For Experiment 2, face presentation (fear and neutral) were time locked to diastole and systole. Participants made subsequent trial-by-trial emotion intensity judgments using a VAS.

