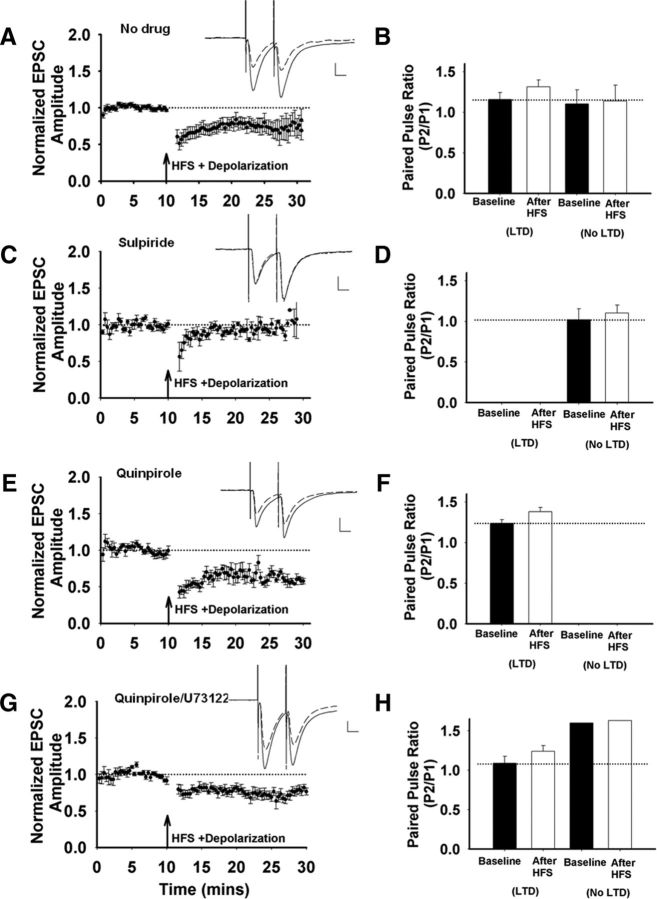
Figure 1.
Corticostriatal LTD in striatopallidal MSNs in dorsolateral striatum. A, EPSC amplitudes were normalized to baseline, averaged, and plotted versus the time of the recording. HFS induces LTD (n = 12 cells/slices, t(11) = 3.35, p = 0.006), Inset, Representative traces before (solid line) and after (dashed line) HFS. Scale bar, 100 pA, 10 ms. B, There is an increase in the PPR from cells that responded to HFS with a significant depression of EPSC amplitude after HFS (n = 8 cells/slices, t(7) = −2.55, p = 0.038). A subset of cells did not show LTD, and the PPR from these cells were not different after HFS (n = 4 cells/slices, t(3) = −0.86, p = 0.452). C, D, HFS induces no LTD in the presence of the D2 receptor antagonist sulpiride (10 μm; n = 6 cells/slices, t(5) = −0.09, p = 0.93; C) and the PPR was not different in sulpiride-pretreated neurons (t(5) = −1.11, p = 0.32; D). E, F, HFS results in consistent LTD in the presence of the D2 receptor agonist quinpirole (10 μm; n = 6 cells/slices, t(5) = 9.09, p = 0.0002; E), HFS-induced LTD in quinpirole-treated neurons is accompanied by an increase in PPR (n = 6 cells/slices, t(5) = −2.44, p = 0.058; F). G, HFS induces LTD when the cell is dialyzed with the PLC inhibitor U73122 (10 μm) in the presence of extracellular quinpirole (10 μm; n = 6 cells/slices, t(5) = −3.25, p = 0.023). H, This LTD is accompanied by a trend toward an increase in PPR in the subset of cells that show LTD (n = 5 cells/slices, t(4) = −2.45, p = 0.07). The LTD magnitude (t(11) = 1.87, p = 0.09) and prevalence (5/6 with quinpirole and the PLC inhibitor vs 6/6 with quinpirole alone, p = 0.3 by χ2) were not different from control recordings without the PLC inhibitor.

