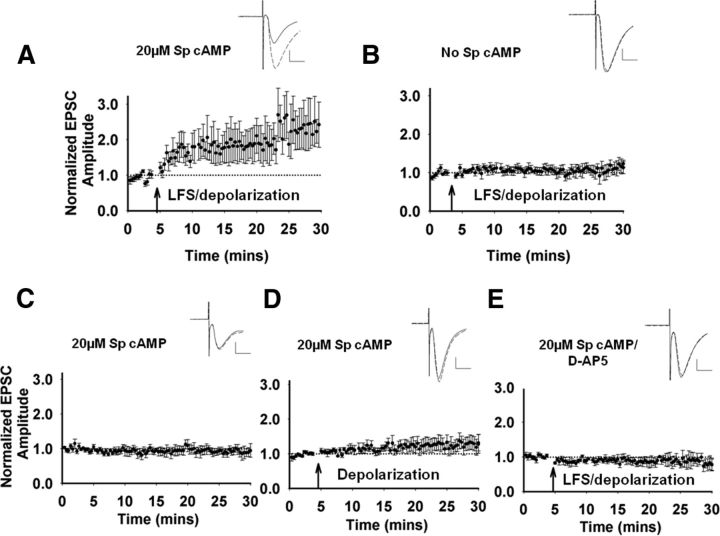
Figure 4.
LFS and corticostriatal LTP. All neurons were dialyzed with 20 μm Sp-cAMP to promote potentiation, except in B. Arrow indicates the time of the conditioning stimulus. Inset, Representative traces before (solid line) and after conditioning stimulus (dashed line). In the case where no conditioning stimulus was given, the solid line represents the first 10 min and the dashed line represents the last 10 min of recording. Scale bar, 100 pA, 10 ms. A, LFS paired with depolarization induced robust LTP (n = 6 cells/slices, t(5) = −2.84, p = 0.04). B, In the absence of 20 μm Sp-cAMP, LFS/depolarization does not increase EPSC amplitude (n = 5 cells/slices, t(4) = −1.18, p = 0.30). C, In the absence of any stimulation, 20 μm Sp-cAMP in the internal solution did not induce a change in EPSC amplitude (n = 5 cells/slices, t(4) = −0.61, p = 0.58). D, Depolarization without LFS induced a weak trend toward LTP (n = 5 cells/slices, t(4) = −2.63, p = 0.06). E, Bath application of the NMDA antagonist d-AP5 (50 μm) inhibited LTP induction (n = 5 cells/slices, t(4) = 0.96, p = 0.39).

