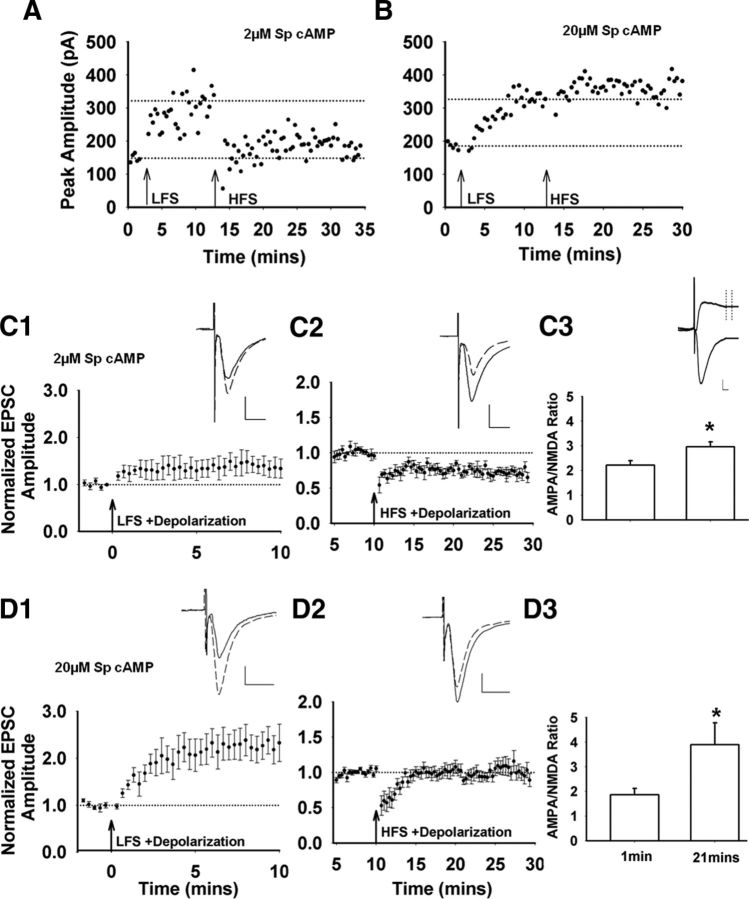
Figure 5.
cAMP modulation of HFS- and LFS-induced corticostriatal plasticity in the same D2-expressing MSNs. Shown is a single-cell example of EPSC amplitudes recorded after LFS and HFS with 2 μm (A) or 20 μm (B) Sp-cAMP administered via the recording pipette. Inset, Representative traces before (solid line) and after (dashed line) LFS/HFS. Scale bar, 100 pA, 10 ms. Note that LFS-induced potentiation data (C1, D1) are the same results presented in Figure 3, B and C. C1, LFS induces a weak potentiation with 2 μm Sp-cAMP in the recording pipette. C2, HFS stimulation, administered 10 min after the LFS, induces robust LTD (n = 5 cells/slices, t(4) = 6.66, p = 0.003). C3, Average AMPA/NMDA ratio 21 min from the start of the recording (t(4) = −3.56, p = 0.02). Inset, Representative traces of AMPA and NMDA EPSC. Scale bar 50 pA, 10 ms. Vertical dotted lines indicate the sampling window after the decay of the AMPA receptor-mediated EPSC, when the NMDA EPSC amplitude was assessed. D1, With 20 μm Sp-cAMP in the recording pipette, LFS induces a robust potentiation. D2, Subsequent HFS has no effect of EPSC amplitude (n = 7 cells/slices, t(6) = −0.03, p = 0.97). D3, This potentiation of EPSC amplitude is accompanied by an increase in the AMPA/NMDA ratio (21 min after the beginning of the recording; t(6) = −2.60 p = 0.04).

