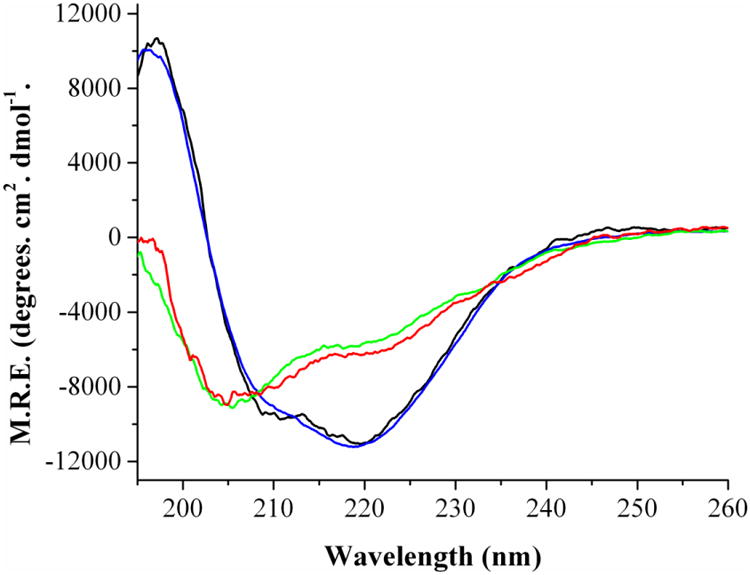
Figure 1.

Secondary Structure of E. coli Fld as determined by far-UV CD. Black: Native apo-Fld at 24 °C, Blue: Native holo-Fld at 24 °C, Red: Unfolded apo-Fld at 86 °C, Green: Unfolded holo-Fld at 94 °C. Protein concentrations were 30 μM, 0.1 mm cuvette, 195-260 nm, Sensitivity = 100 millidegrees, data pitch = 0.1 nm, accumulation of 4 scans.
