
Figure 4.
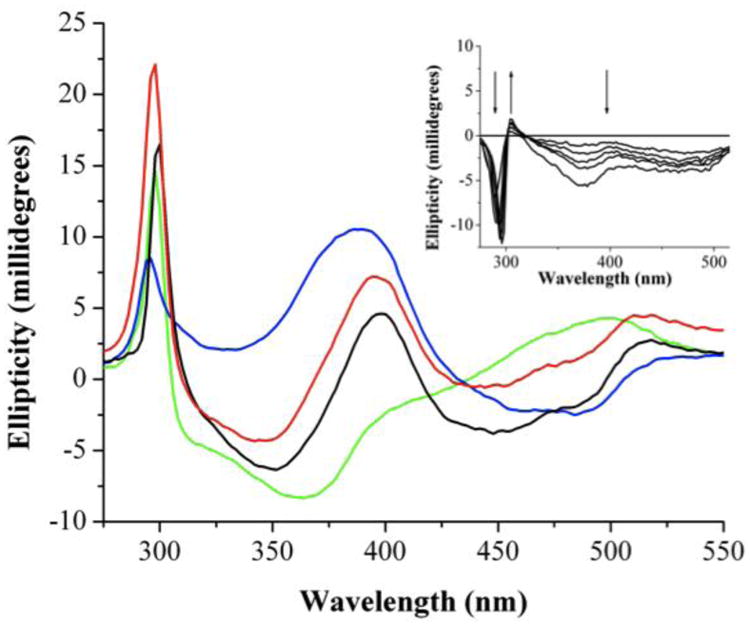
Binding of holo-Fld to FNR as monitored by CD spectroscopy. Blue: 30 μM FNR; Green: 30 μM Fld; Red: spectral addition of FNR and Fld; Black: Mixture of 30 μM FNR and 30 μM Fld. Inset shows difference spectra corresponding to a titration of (0 μM, 7.5 μM, 15 μM, 22.5 μM, 30 μM, 60 μM) Fld into FNR (30 μM) to show changes in the near-UV and visible regions as a result of Fld binding FNR.