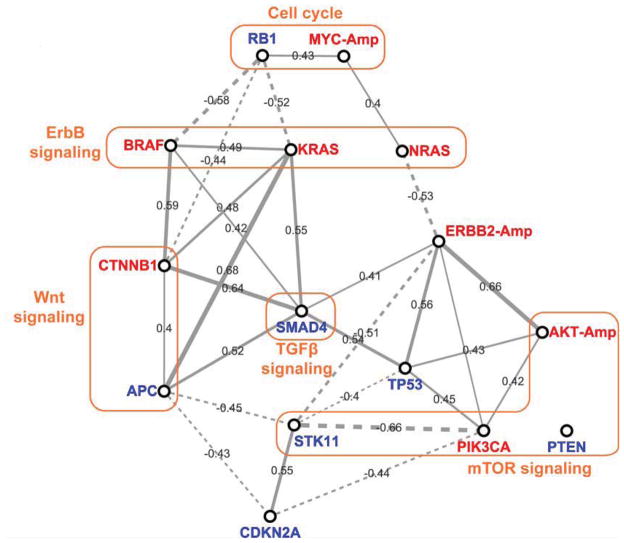
Figure 2. Correlation network of mutational genotypes.
Pearson’s correlation coefficient (PCC) values between genotypes was calculated using the CLEA values (−log p-value) of the 34 compounds in Fig. 1B. The PCC cutoff values for a link are 0.4 and −0.4 for positive and negative correlations, respectively. The varied thickness of the links between the genotype nodes quantitatively represents PCCs. Red represents oncogenes, and blue represents repressors.

