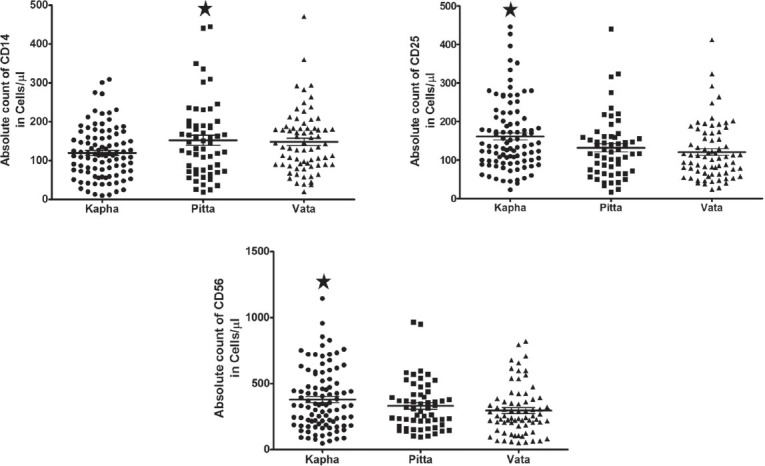
Figure 1.

Expression of significant cluster differentiation markers across three prakriti. Scatter plot for expression of CD14, CD25 and CD56 which are significant in expression between three dominant prakriti (P < 0.05). Significance with the highest mean value was represented in * sign
