
Figure 2.
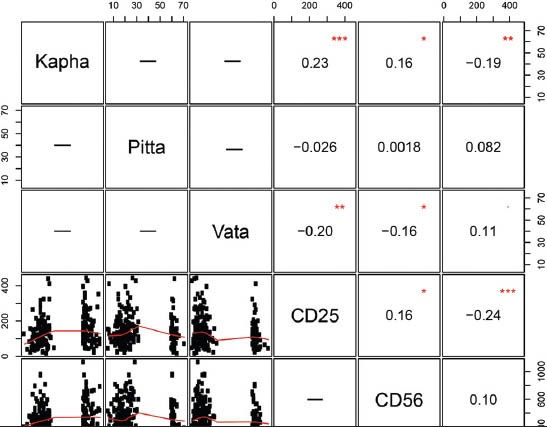
Pearson correlation matrix to find correlation between percentage of prakriti and cluster differentiation 14, CD25 and CD56 expression. Data represented as the percentage values of kapha, pitta and vata obtained from the Ayusoft against, the absolute count of CD marker of the population studied. The values inside the boxes are the Pearson's correlation r values and statistical significance is represented by * sign